
Quantify the Factor Importance and the Effect of Mask Policy on COVID-19 Spread in the United States with Machine Learning

Abstract:
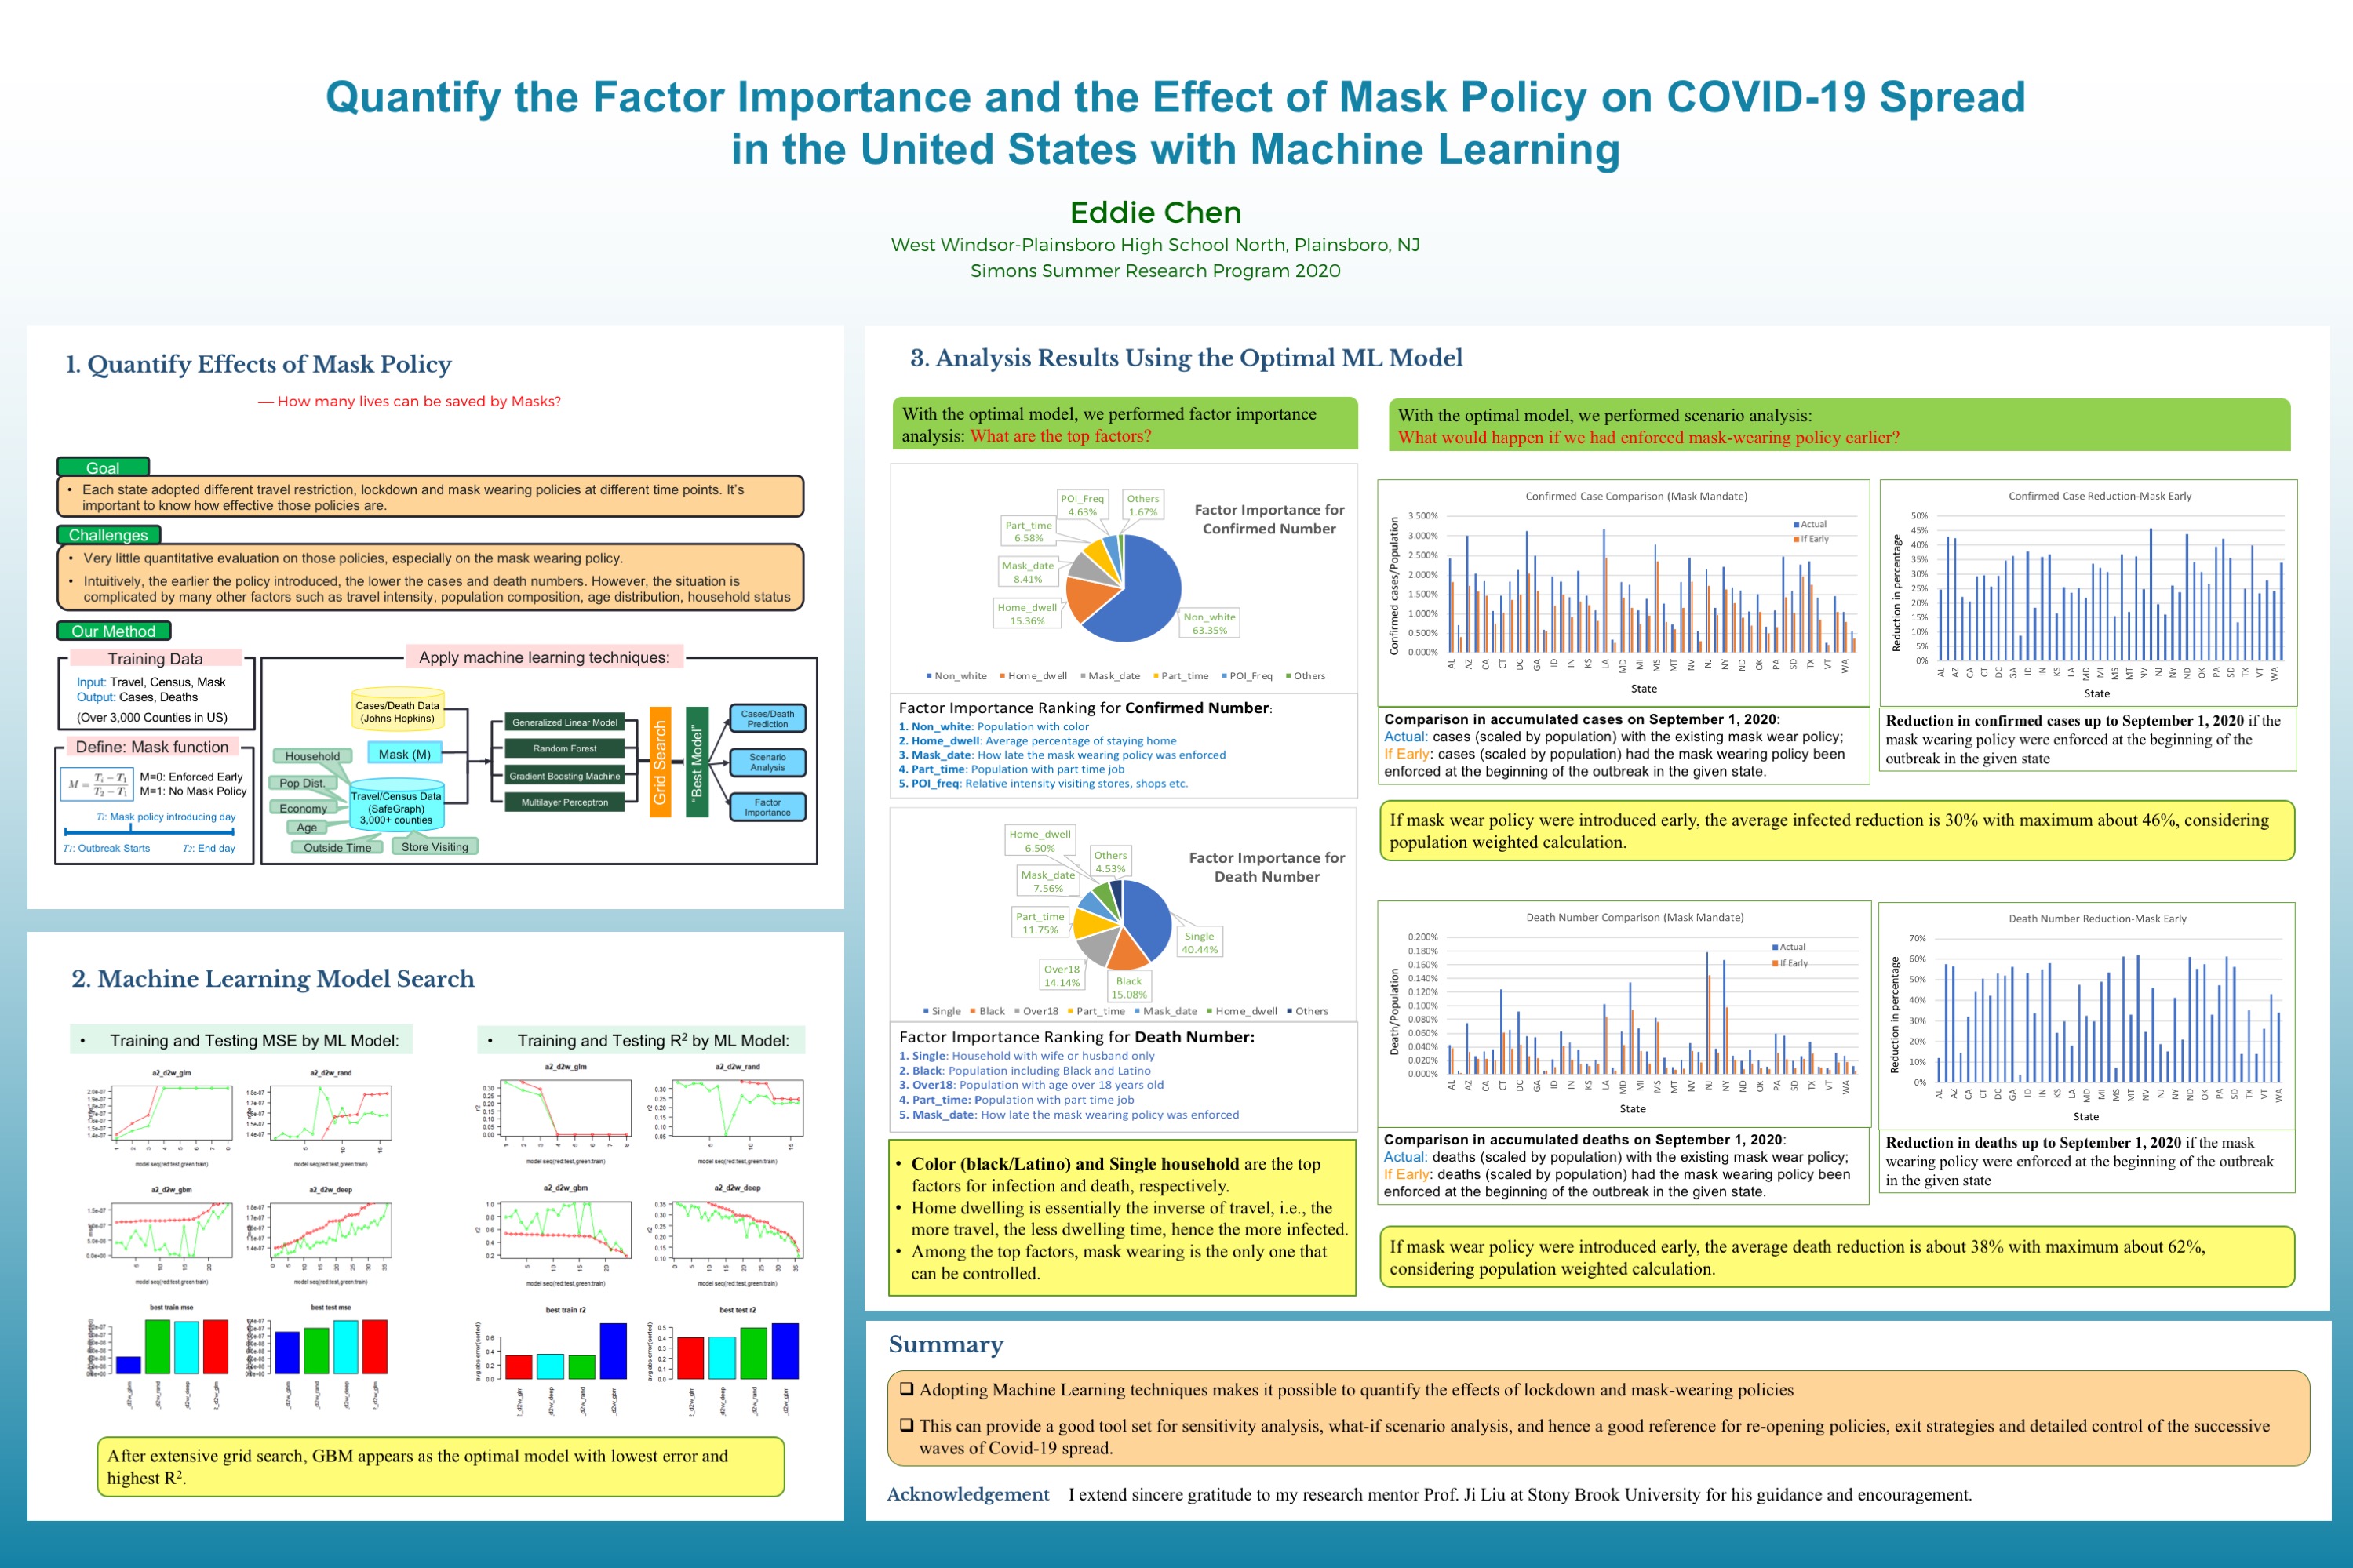
Machine learning (ML) algorithms are utilized to quantify the factor importance and the effect of mask policy on the accumulated Covid-19 confirmed cases and deaths. We make use of the mask policy data for the 50 US states, the census, mobility, and social distancing data from SafeGraph, the confirmed cases and deaths data from Johns Hopkins for over 3,000 US counties, running through four ML algorithms with a hyper-parameter grid searching framework to find the best models in predicting the number of cases and deaths.After applying the best models to each county and aggregating the results to the state level, we find the following:
• If the mask mandate were adopted at the beginning of the outbreak, the accumulated confirmed cases could have been reduced by extra 7% to 45%, the deaths by extra 3% to 62% depending on the history of the actual mask mandate, lockdown policy and census data for the given state.
• The importance ranking of factors for predicting the confirmed cases number from high to low is: the percentage of Black & Latino population, home dwelling time, mask mandate onset time and overall travel intensity.
• The importance ranking of factors for explaining the deaths number from high to low is: single household ratio, the percentage of Black & Latino population, percentage of part-time workers, and mask mandate onset time.
These findings are useful in various public policy decisions including the detailed census block group (CBG) level reopening strategies.
Bibliography/Citations:
Bibliography:
1. Face masks during the covid-19 pandemic in the united states. Wikipedia, 2020. URL https://en.wikipedia.org/wiki/Face_masks_during_the_COVID- 19_pandemic_in_the_United_States.
2. SafeGraph. Places schema. 2020. URL https://docs.safegraph.com/docs/places- schema.
3. SafeGraph. Social distancing metrics. 2020. URL https://docs.safegraph.com/docs/social- distancing- metrics.
4. Covid-19. Readme. 2020. URL https://github.com/CSSEGISandData/COVID- 19/blob/master/README.md.
5. Covid-19. Data. 2020. URL https://github.com/CSSEGISandData/COVID- 19/tree/master/csse_covid_19_data.
6. Covid-19. gitlink. 2020. URL https://github.com/CSSEGISandData/COVID- 19.
7. Here’s what we know about the u.k. coronavirus variant, . URL https://www.washingtonpost.com/health/2020/12/20/new- covid- mutation- uk/.
8. New u.k. covid strain discovered in the united states: What we know, . URL https://www.nytimes.com/2020/12/21/health/new- covid- strain- uk.html.
9. Nowak G et al. Payne DC, Smith-Jeffcoat SE. Sars-cov-2 infections and serologic responses from a sample of u.s. navy service members – uss theodore roosevelt.MMWR Morb Mortal Wkly Rep.,69(23), April 2020. URL https://www.ncbi.nlm.nih.gov/pubmed/32525850.
10. Panjangampatthana A et al. Doung-Ngern P, Suphanchaimat R. Case-control study of use of personal protective measures and risk for severe acute respiratory syndrome coronavirus 2 infection. Emerg Infect Dish, 26(11), 2020. URL https://www.ncbi.nlm.nih.gov/pubmed/32931726.
11. V. Chernozhukov, H. Kasahara, and P. Schrimpf. Causal impact of masks, policies, behavior on early Covid-19 pandemic in the U.S. September 12, 2020. .
12. A. Karaivanov, S. Lu, H. Shigeoka, C. Chen, and S. Pamplona. Face masks, public policies and slowing the spread of COVID-19: Evidence from canada. Working Paper 27891, National Bureau of Economic Research, October 2020.
13. Wei Lyu and George L. Wehby. Community use of face masks and COVID-19: Evidence from a natural experiment of state mandates in the US. Health Affairs, 39(8):1419–1425, 2020. . URL https://doi.org/10.1377/hlthaff.2020.00818. PMID: 32543923.
14. Johannes Rodec Timo Mitzea, Reinhold Kosfeldb and Klaus Wälde. Face masks considerably reduce covid-19 cases in germany. Proceedings of the National Academy of Sciences, 2020. ISSN 0027-8424. . URL https://www.pnas.org/content/117/29/16732.
15. Generalized linear model. URL https://www.sciencedirect.com/topics/mathematics/generalized- linear- model.
16. Random forest algorithm. URL https://builtin.com/data- science/random- forest- algorithm.
17. Gradient boosting machine. URL https://en.wikipedia.org/wiki/Gradient_boosting.
18. Multilayer perceptron. URL https://en.wikipedia.org/wiki/Multilayer_perceptron.
19. SafeGraph. Guide to points-of-interest data. 2020. URL https://www.safegraph.com/points- of- interest- poi- data- guide.
20. H2o ai framework, . URL https://www.h2o.ai.
21. H2o variable importance, . URL https://docs.h2o.ai/h2o/latest- stable/h2o- docs/variable- importance.html.
22. Günter Kampf. Protective effect of mandatory face masks in the public—relevant variables with likely impact on outcome were not considered. Proceedings of the National Academy of Sciences, 117(44):27076–27077, Nov. 2020. ISSN 0027-8424. .
23. Qin Xiang Ng, Michelle Lee Zhi Qing De Deyn, and Wee Song Yeo. Do face masks help? is not the question. Proceedings of the National Academy of Sciences, 117(44):27078–27079, 2020. ISSN 0027-8424. . URL https://www.pnas.org/content/117/44/27078.
24. Renyi Zhang, Yixin Li, Annie L. Zhang, Yuan Wang, and Mario J. Molina. Identifying airborne transmission as the dominant route for the spread of covid-19. Proceedings of the National Academy of Sciences, 117(26):14857–14863, Jun. 2020. ISSN 0027-8424. .
25. Cornelia Betsch, Lars Korn, Philipp Sprengholz, Lisa Felgendreff, Sarah Eitze, Philipp Schmid, and Robert Böhm. Social and behavioral consequences of mask policies during the covid-19 pandemic. Proceedings of the National Academy of Sciences, 117(36):21851–21853, 2020. ISSN 0027-8424.
Additional Project Information
Project files
Research Plan:
Rationale:
COVID-19 has been damaging millions of people's health, affecting billions of people's lives and costing trillions of dollars in the world economy. It is important to study how to control the spread effectively from an epidemiological perspective. My goal is to build a model incorporating big data such as census, mobility, confirmed cases, and social distance policy etc. to study the dynamics and the driving forces for COVID-19 spread and use the model to recommend better control policies from epidemiology perspective.
I have reviewed the literature thoroughly in getting the state-of-art on the general theory for epidemics, as well as modeling specific for COVID-19 spread. I found that there is not much quantitative study on the effect of mask policy, which has been a long-standing debating topic across the country. I would like to answer specific questions like “had the mask policy been mandated at the beginning of the outbreak in each state, how many people would have been protected from infection and saved from death?” To this end, I noticed that after COVID-19 started spreading out all over the U.S., each state adopted its own mask mandate at different time points. This combined with the census data and mobility data for over 3,000 counties provide an abundant data source for us to use machine learning algorithms to build a reliable model to not only quantify the impact of mask mandate, but also predict the accumulated infected and death numbers and identify the most important factors in controlling the virus spreading.
Research Questions:
- How to build a data driven covid-19 spread model with machine learning?
- What’s the effect/impact of various policies such as traveling restrictions, social distancing, lockdown policies and mask mandate?
- Had the mask policy been mandated at the beginning of the outbreak in each state, how many people would have been protected from infection and saved from death?
- What are the recommendations on reopening policies and exit strategies based on our models?
Procedures:
- Will thoroughly review literature to get the state of art on general epidemic theory and the modeling specific for Covid-19 spread, from which find out the direction for potential improvements.
- Will research data sources and write automatic data scraper/processor. Will study mobility, census data from SafeGraph and the Covid-19 cases data from Johns Hopkins. As roughly estimated the raw data is huge (over 3 TB), a kdb+/q database needs to be created for it and q analytics needs to be developed as well.
- Will devise the idea of applying machine learning (ML) to census, mobility, and cases data. A mask function needs to be formulated and several ML models developed as well as a model search framework.
- After the optimal model is found, factor importance will be analyzed and scenario analysis performed, which allows the quantification of lives saved by mask policy as a special application.
Risk and Safety:
As there are no experiments needed, there are no risk or safety concerns.
Data Analysis:
Use R and kdb/q to do data analysis as described in the Procedures section.
Questions and Answers
1. What was the major objective of your project and what was your plan to achieve it?
a. Was that goal the result of any specific situation, experience, or problem you encountered?
b. Were you trying to solve a problem, answer a question, or test a hypothesis?
The objective is to create better mathematical models for covid-19 spread to help out in policy making during pandemic times.
My plan was applying the SEIR model and machine learning algorithms to the detailed county level case data, real time mobility data and census data , together with each state’s policy history(such as mask mandate etc.) to obtain realistic models with better prediction accuracy.
2. What were the major tasks you had to perform in order to complete your project?
a. For teams, describe what each member worked on.
The major tasks include:
- Designing a mask function to map mask mandate to a continuous number from 0 to 1
- Collecting county level census data and mobility data to make sure all potential factors are considered.
- Applying machine learning methods to generate the best model
- Performing scenario analysis and factor importance analysis with the optimal model
3. What is new or novel about your project?
a. Is there some aspect of your project's objective, or how you achieved it that you haven't done before?
b. Is your project's objective, or the way you implemented it, different from anything you have seen?
c. If you believe your work to be unique in some way, what research have you done to confirm that it is?
Novelties of my project:
- The first to construct a numerical function for mask policy which is compatible with other factors while doing machine learning analysis.
- The first to incorporate a large number of factors from census data and real time mobility data in analyzing the impact of mask mandate.
- The first to apply several ML algorithms to such a comprehensive input and obtain consistent results without any subjective assumptions. Our results are more reliable than existing papers because we have no subjective assumptions and we considered more inputs with ML to handle the complexity.
- It provides a new, more practical and quantitative procedure to analyze the factors and policy efficiency in controlling the covid-19 spread.
4. What was the most challenging part of completing your project?
a. What problems did you encounter, and how did you overcome them?
- I take initiative to do my own research and search for resources. For this project, I scoured many sites for COVID-19 and travel data. Since the size was huge, I needed to create databases, and again searched extensively for instructions. For every technical problem that arose, I was determined to find the solution proactively.
- The other difficulty is how to find the right theory for the real data, I found it is not easy to find a good model when the data is noisy and with many factors. I overcame this by reading extensively on the existing research papers and thinking deeply with a physics mindset.
b. What did you learn from overcoming these problems?
After overcoming these problems, I realized the usefulness and prevalence of other subjects and techniques/skills aside from epidemiology. Mathematics and computer skills, of course, were two key ingredients in coming up with the right machine learning algorithms and statistics. The thinking process I developed from physics helped me get a better understanding of the situation, as well as create better models and unify theory with experiment.
5. If you were going to do this project again, are there any things you would you do differently the next time?
During this project, I was learning as I was working. For example,I learned how to optimize the parameters as I was coding my model and learned database language kdb+ while organizing the huge dataset. If I were to do this project again, I would spend much less time learning since now I have that knowledge already.
6. Did working on this project give you any ideas for other projects?
Working on this project taught me skills such as working with optimizers as well as dealing with noise, both of which I found to be extremely helpful and relevant for another project I am working on (related to quantum computing).
7. How did COVID-19 affect the completion of your project?
The COVID-19 pandemic has forced me to stay at home and communicate with people virtually, so I got very limited guidance and help from my mentor and supporting stuff. For example, on many occasions, I had to solve various computer issues, which are supposed to be handled by system administrators, on my own, e.g., one midnight the system log is full due to a huge data fetching process; another time the shared account complained file permission and etc...