
Finding pi Using Monte Carlo Method

Abstract:
Monte Carlo Method works very well for calculating unknowns using random experiments. For the experiment with dry gains, I dropped Moong beans on the square with arc, and counted how many fell inside the arc and inside the square. I calculated the estimated value of pi as 4 times the ratio of #in arc divided by #in square. Then I repeated the experiment 10 times and took average value of estimated pi. I noticed that the Moong beans are very bouncy and they tend to roll away easily, making it harder to get a uniform random distribution. To overcome the challenge, I used Split Red Lentilsin the next experiment. In both sets of experiments, I got estimated value of pi to be 3.15, which is fairly close to the actual value. In case of Moong beans, the individual experiment results were between 2.9 and 3.33, whereas the Split Red Lentils experiment results ranged from 3 to 3.6.Next, I wrote a computer program using scratch (which I had learned in school) to generate random numbers and plot them in a square. The points that are inside the arc are colored blue and the ones outside the arc are colored red. With large number of points, you can see the arc dividing the red and blue points. Since it is a computer program, it is easy to simulate dropping a large number of points. I ran the program for 100 points, repeated 10 times, and got average estimated value of pi to be 3.13. The estimated value of pi from these 10 individual runs ranged from 3 to 3.4, which was a narrower range than the beans experiment. The narrower range is likely because of the computer generating more evenly spread random numbers than manually dropping beans on paper.
When I ran the computer program for 500, 1000, 5000 and 10000 points, and repeated each experiment 10 times, I got average estimated valueof pi to be 3.12, 3.16, 3.13 and 3.13. While all of these values are fairly close to the actual value of pi, the range of the individual experiment results got narrower as number of points increased. The 10000 points experiment results were between 3.12 and 3.15, with average of 3.13. As per my hypothesis, the quality of results indeed improves when we use more points, and we see that in the results.
The Monte Carlo Method is a powerful tool that helps us calculate something using random numbers. The method is easy to understand, and fun to work with.
Bibliography/Citations:
No additional citationsAdditional Project Information
Research Plan:
This project is about learning and using the Monte Carlo Method, used in several areas of science, engineering and business. The Monte Carlo Method involves taking random readings and processing them in a certain way to find an unknown. The method can be used to verify hypothesis or theory, or find value of unknown entities.
The plan is to apply the method and conduct experiments on a diagram of an arc in a square as shown below. The area of the arc is pi-fourth of the area of the square. If we randomly throw small objects (dry grains, for example) in this square, some will fall inside the arc in the blue area, and some will be outside the arc in the red area. If they are randomly and uniformly distributed, the ratio of how many are in the arc to the total objects in the square would give us an estimate of the ratio of the areas. By performing the experiment multiple times, and taking average of the results, we will be able to estimate the ratio of area of the arc to the area of the square. Since this ratio is supposed to be pi/4, multiplying the result by 4 will give estimated value of pi.

Since we know the value of pi, we will be able to tell if the estimate we got from the method was reasonable. While we already know the value of pi, we are not using it anywhere in the experiments, we are using randomly thrown objects to estimate the value.
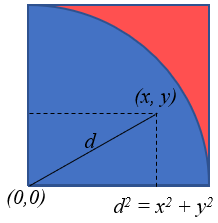
Next, we perform the experiment using computer to generate the random numbers. In this case, we first generate random numbers (x, y) to simulate dropping an object in a square, and calculate the distance of the dropped point from corner of the square (0, 0) using Pythagoras theorem, as shown below. Comparing the distance d with the radius of the arc, we can tell if the randomly generated point is inside the arc or outside. By repeating the process and keeping track of how many points are inside and outside the arc, we then calculate the estimated value of pi, just like in the grains experiment.
Using the grains and computer simulation experiments, we learn the Monte Carlo Method, which is useful in calculating unknowns and verifying theoretical calculations. Since the computer simulations can be easily run for a large number of points, we will do several runs with different number of points to study how number of points affects the result. The hypothesis is that the quality of results will improve as we increase number of points.