
Can You Resist the Force?
Abstract:
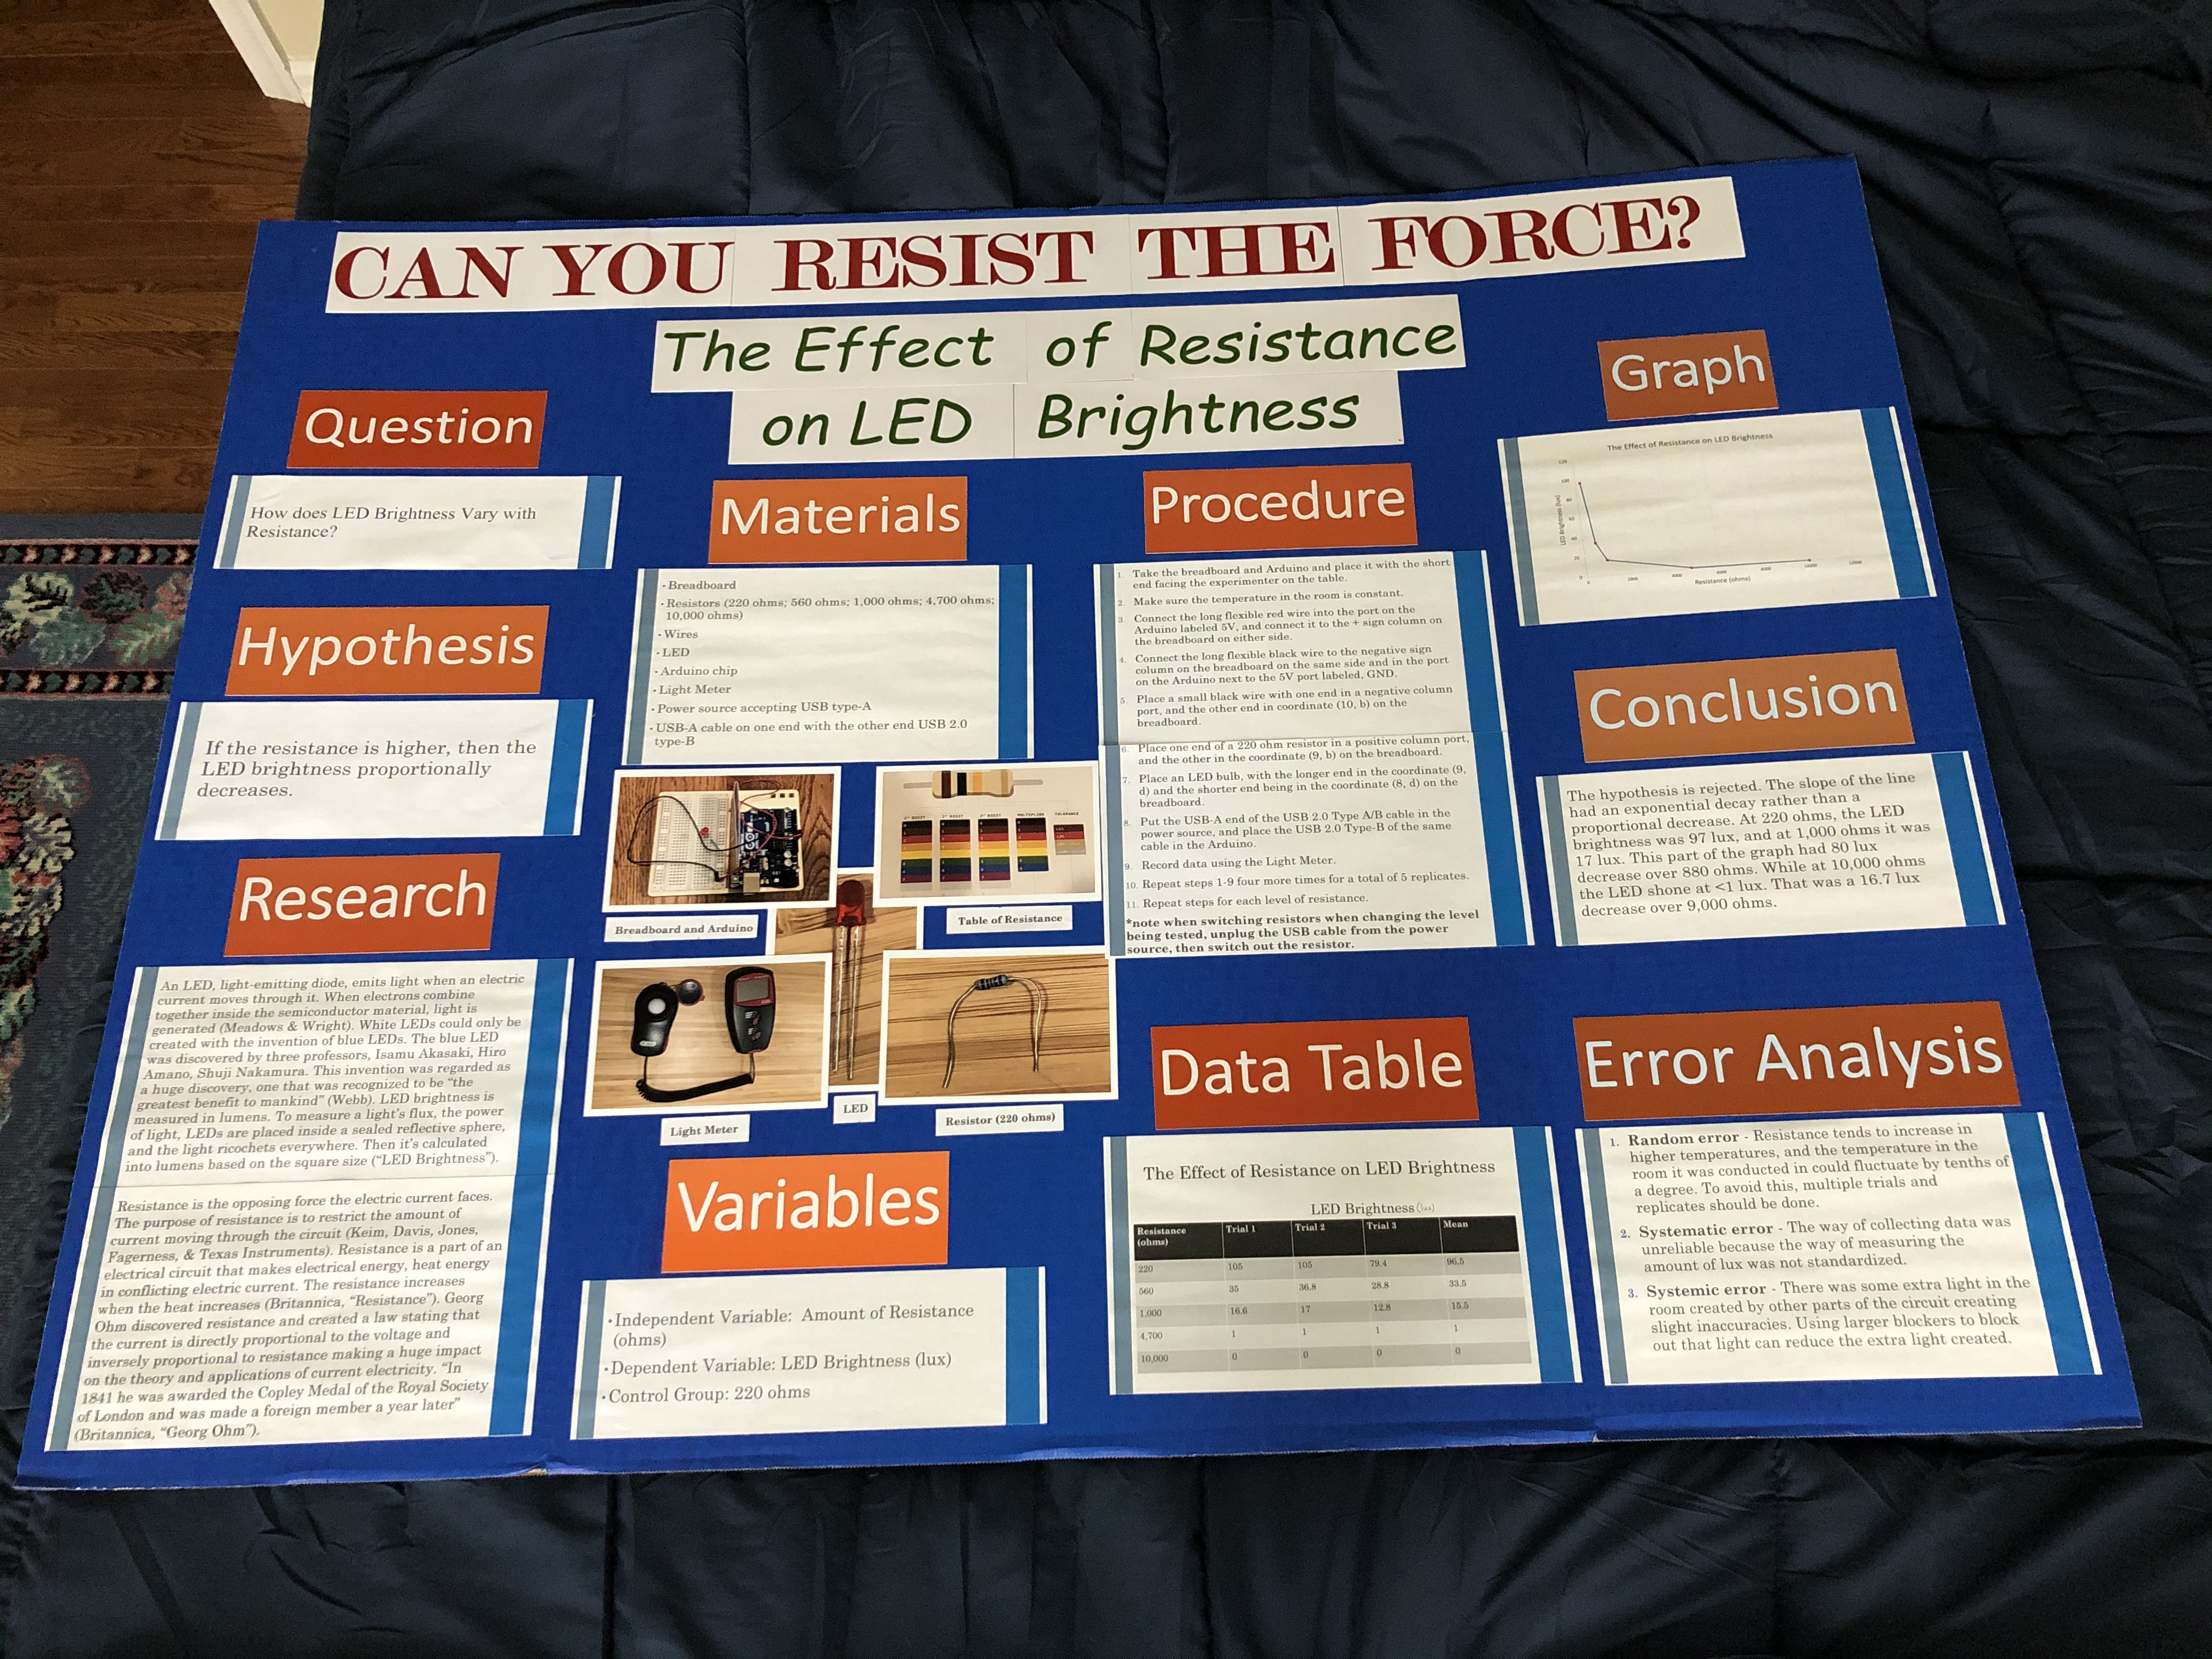
The purpose of this experiment was to understand how LEDs lower in brightness when triggered by a sliding switch. The hypothesis was if the resistance increases, then the LED brightness will proportionally decrease. The constants in the experiment were:LED, breadboard, wires, the Arduino chip used to transfer energy from source to breadboard, power source, light meter, temperature, room of the house where the experiment will take place, the USB 2.0 Type-A/B cable used; with the control group being 220 ohms. The independent variable in the experiment is the resistance measured in ohms, while the dependent variable in the experiment is the LED brightness measured in lux. The LED brightness will be measured by placing the glass of the light meter on the LED itself. The collected results of the experiment were 96.5 lux for 220 ohms, 33.5 lux for 560 ohms, 15.5 lux for 1,000 ohms, 1 lux for 4,700 ohms, and <1 lux for 10,000 ohms. These results rejected the hypothesis because the slope of the line being formed exponentially decreased rather than a linear decrease. If this experiment were to be redone in the future, the way of placing the light meter would be standardized to allow for only one number to pop up instead of several other numbers. Also, a box with holes, forthe Arduino ports, would be used to block out the light generated by the Arduino.Bibliography/Citations:
Britannica, The Editors of Encyclopaedia. “Resistance.” Encyclopædia Britannica, Encyclopædia Britannica, Inc., 20 June 2019, https://www.britannica.com/technology/resistance-electronics.
Britannica, The Editors of Encyclopaedia. “Georg Ohm.” Encyclopædia Britannica, Encyclopædia Britannica, Inc., 2 July 2019, https://www.britannica.com/biography/Georg-Ohm.
Keim, Robert, et al. “Resistance.” All About Circuits, EETech Media, 8 July 2019, https://www.allaboutcircuits.com/textbook/direct-current/chpt-1/resistance/.
“LED Brightness.” Diode Dynamics, Diode Dynamics, https://www.diodedynamics.com/info/research/led/led-brightness.html.
Meadows, Carrie, and Maury Wright. “What Is an LED?” LEDs Magazine, Endeavor Business Media, 1 Sept. 2004, https://www.ledsmagazine.com/leds-ssl-design/materials/article/16701292/what-is-an-led.
Webb, Jonathan. “Invention of Blue LEDs Wins Physics Nobel.” BBC News, BBC, 7 Oct. 2014, https://www.bbc.com/news/science-environment-29518521.
Additional Project Information
Research Plan:
Materials: Breadboard, Resistors (220 ohms; 560 ohms; 1,000 ohms; 4,700 ohms; 10,000 ohms;), Wires, Arduino chip, Power Source accepting USB-A, Light Meter, USB 2.0 Cable Type A/B, LED
Procedure:
1. Take the breadboard and Arduino and place it with the short end facing the experimenter on the table.
2. Make sure the temperature in the room is constant.
3. Connect the long flexible red wire into the port on the Arduino labeled 5V, and connect it to the + sign column on the breadboard on either side.
4. Connect the long flexible black wire to the negative sign column on the breadboard on the same side and in the port on the Arduino next to the 5V port labeled, GND.
5. Place a small black wire with one end in a negative column port, and the other end in coordinate (9, b) on the breadboard.
6. Place one end of a 220-ohm resistor in a positive column port, and the other in the coordinate (8, b) on the breadboard.
7. Place an LED bulb, with the longer end in the coordinate (8, d) and the shorter end being in the coordinate (9, d) on the breadboard.
8. Put the USB-A end of the USB-A cable in the laptop or computer, and place the USB 2.0 type-B of the same cable into the Arduino.
9. Record data by placing the glass part of the light meter on the LED.
10. Repeat steps 1-9 four more times for a total of 5 replicates.
11. Repeat steps for each level of resistance.
*note when switching resistors when changing the level being tested, unplug the USB cable from the power source, then switch out the resistor.
Data Analysis:
- The graph will be a line graph, both sets of data are continuous
- The x-axis on the graph is the amount of resistance measured in ohms, and the y-axis is the LED brightness measured in lux
- The highest reading taken will be the reading recorded
Risk Analysis: There is a possible danger from electrical shock or burn. The condition of the wires and apparatus should be checked. Hands should also be protected by insulators to prevent the current shocking the experimenter.
All photos by experimenter